

File:Vapor Pressure Chart.png
Vapor_Pressure_Chart.png (301 × 397 pixels, file size: 9 KB, MIME type: image/png)
| |
This is a file from the Wikimedia Commons. Information from its description page there is shown below.
Commons is a freely licensed media file repository. You can help. |
Summary
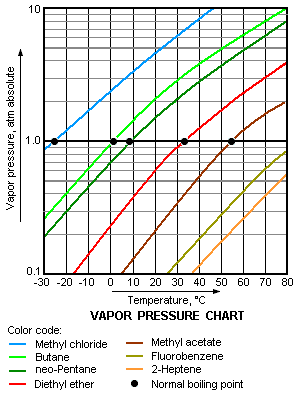
| Description | This image is a chart of vapor pressure versus temperature, for various liquids. The chart's y-axis is logarithmic and the x-axis is linear. It includes data for Propane, Methyl chloride, Butane, neo-Pentane, Diethyl ether, Methyl acetate, Fluorobenzene, and 2-Heptene. |
| Date | 5 October 2007 |
| Source | Own work |
| Author | Mbeychok |
 |
This graph image could be recreated using vector graphics as an SVG file. This has several advantages; see Commons:Media for cleanup for more information. If an SVG form of this image is already available, please upload it. After uploading an SVG, replace this template with {{ vector version available|new image name.svg}}. |
Licensing
 |
I, the copyright holder of this work, release this work into the public domain. This applies worldwide. In some countries this may not be legally possible; if so: I grant anyone the right to use this work for any purpose, without any conditions, unless such conditions are required by law.
|
File usage
The following pages on Schools Wikipedia link to this image (list may be incomplete):
Did you know...?
SOS Children's Villages chose the best bits of Wikipedia to help you learn. SOS Childrens Villages works in 133 countries and territories across the globe, helps more than 62,000 children, and reaches over 2 million people in total. We have helped children in Africa for many years - you can help too...