

File:Global Carbon Emission by Type to Y2004.png

| |
This is a file from the Wikimedia Commons. Information from its description page there is shown below.
Commons is a freely licensed media file repository. You can help. |
| Description |
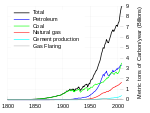
Español: Emisiones globales de dióxido de carbono discriminadas según su origen.
English: Global annual fossil fuel carbon dioxide emissions through year 2004, in million metric tons of carbon, as reported by the Carbon Dioxide Information Analysis Centre .
|
||||||||
| Date | 7 March 2008 | ||||||||
| Source | This figure is original and was prepared for Commons by Mak Thorpe using data from available at this US Department of Energy web page ( Archived at 2008-05-08T06:07:13).
Excel was used on the CSV file data to recreate a graph with the same format as the earlier version with older data to year 2000 created for the Global Warming Art project by Robert A. Rohde. |
||||||||
| Author | Mak Thorpe | ||||||||
| Permission ( Reusing this file) |
|

 |
File:Global Carbon Emissions.svg is a vector version of this file. It should be used in place of this raster image when superior. File:Global Carbon Emission by Type to Y2004.png
For more information about vector graphics, read about Commons transition to SVG.
|
 |
Notes
The data is originally presented in terms of solid (e.g. coal), liquid (e.g. petroleum), gas (i.e. natural gas) fuels, and separate terms for cement production and gas flaring (i.e. natural gas lost during oil and gas mining). Unlike the year 2000 graph, the gas flaring (the smallest of all categories) was not added to the total for natural gas. Note that the carbon dioxide releases from cement production result from the thermal decomposition of limestone into lime, and so technically are not a fossil fuel source.
Related figures
-

Total global carbon emissions, logarithmic scale.
-

Carbon dioxide emissions by region, linear scale.
-

Carbon dioxide concentrations during the last 400 thousand years.
-

Recent carbon dioxide concentrations measured at Mauna Loa.
File usage
Find out more
Wikipedia for Schools is one of SOS Children's Villages' many educational projects. SOS Childrens Villages is there for the children in our care until they are ready for independence. Try to find out how you can help children in other countries on our web site.