

File:Normal distribution pdf.png
| |
This is a file from the Wikimedia Commons. Information from its description page there is shown below.
Commons is a freely licensed media file repository. You can help. |
Summary
 |
File:Normal Distribution PDF.svg is a vector version of this file. It should be used in place of this raster image when superior. File:Normal distribution pdf.png
For more information about vector graphics, read about Commons transition to SVG.
|
 |
|
File:Normal distribution pdf.svg is a vector version of this file. It should be used in place of this raster image when superior. File:Normal distribution pdf.png
For more information about vector graphics, read about Commons transition to SVG.
|
 |
Choose which version suits you better.
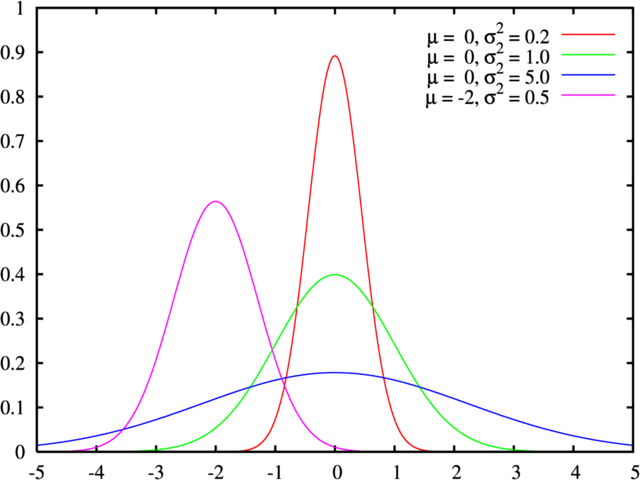
The normal distribution
 |
Permission is granted to copy, distribute and/or modify this document under the terms of the GNU Free Documentation License, Version 1.2 or any later version published by the Free Software Foundation; with no Invariant Sections, no Front-Cover Texts, and no Back-Cover Texts. A copy of the license is included in the section entitled GNU Free Documentation License.
|
| This file is licensed under the Creative Commons Attribution-Share Alike 3.0 Unported license. | ||
|
||
| This licensing tag was added to this file as part of the GFDL licensing update.
|
gnuplot source under GPL:
_ln_dnorm(x, m, s) = -0.5 * log(2*pi) - log(s) - 0.5*((x-m)*1.0/s)**2
set samples 1001
set terminal postscript enhanced colour solid lw 2 "Times-Roman" 20
set output

set xrange [-5:5]
set xtics 1
set yrange [0:1]
set ytics 0.1

f(x,y,z) = dnorm(x, y, sqrt(z)) #use variance, not sd!
set key 3.8,0.94

#f(x,y,z) = pnorm(x, y, sqrt(z))
#set key 3.8,0.2

plot \
|
This work is free software; you can redistribute it and/or modify it under the terms of the GNU General Public License as published by the Free Software Foundation; either version 2 of the License, or any later version. This work is distributed in the hope that it will be useful, but without any warranty; without even the implied warranty of merchantability or fitness for a particular purpose. See version 2 and version 3 of the GNU General Public License for more details. |
File usage
Want to know more?
SOS Children has brought Wikipedia to the classroom. SOS Children's Villages believes education is an important part of a child's life. That's why we ensure they receive nursery care as well as high-quality primary and secondary education. When they leave school, we support the children in our care as they progress to vocational training or higher education. We have helped children in Africa for many years - you can help too...