

File:WheatYield.png
Size of this preview: 640 × 384 pixels.
| |
This is a file from the Wikimedia Commons. Information from its description page there is shown below.
Commons is a freely licensed media file repository. You can help. |
Summary
| Description |
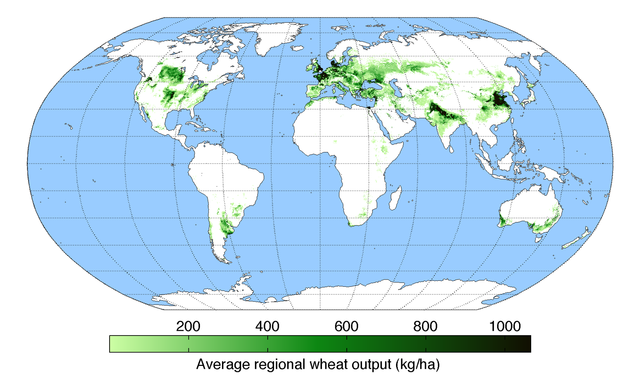
English: Map of wheat production (average percentage of land used for its production times average yield in each grid cell) across the world compiled by the University of Minnesota Institute on the Environment with data from: Monfreda, C., N. Ramankutty, and J.A. Foley. 2008. Farming the planet: 2. Geographic distribution of crop areas, yields, physiological types, and net primary production in the year 2000. Global Biogeochemical Cycles 22: GB1022
|
| Date | 3 March 2010 |
| Source | Own work |
| Author | AndrewMT |
Licensing
|
File usage
The following pages on Schools Wikipedia link to this image (list may be incomplete):
Schools Wikipedia facts
SOS Children's Villages chose the best bits of Wikipedia to help you learn. In 133 nations around the world, SOS Children works to bring better education and healthcare to families in desperate need of support. Try to find out how you can help children in other countries on our web site.