

File:Nuclear Power History.png
| |
This is a file from the Wikimedia Commons. Information from its description page there is shown below.
Commons is a freely licensed media file repository. You can help. |
Transwiki approved by: w:en:User:Dmcdevit
This image was copied from wikipedia:en. The original description was:
Contents
|
Description
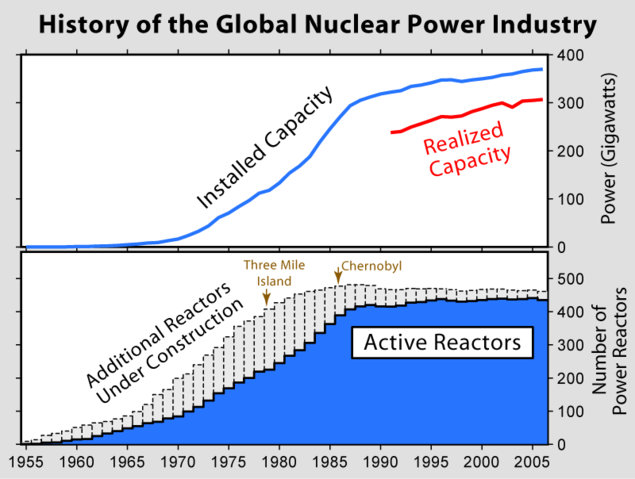
This figure shows the history of nuclear power generation.
The top panel shows the installed global nuclear capacity (in gigawatts), and since 1991, the fraction of that power which was actually available after accounting for planned and unplanned outages. The bottom panel shows the number of active nuclear reactors by year (in blue) and dashed extensions indicating the number of additional reactors that were under construction during each year. The average construction time was slightly more than 7 years.
Also indicated are the times of the Three Mile Island (1979) and Chernobyl (1986) nuclear accidents.
Data presented is from the International Atomic Energy Agency, principally "Nuclear Power Reactors in the World" with additions received by direct communication.
Copyright
This image was created by Robert A. Rohde for the Global Warming Art project.
 |
Permission is granted to copy, distribute and/or modify this document under the terms of the GNU Free Documentation License, Version 1.2 or any later version published by the Free Software Foundation; with no Invariant Sections, no Front-Cover Texts, and no Back-Cover Texts. A copy of the license is included in the section entitled GNU Free Documentation License.
|
| This file is licensed under the Creative Commons Attribution-Share Alike 3.0 Unported license. | ||
|
||
| This licensing tag was added to this file as part of the GFDL licensing update.
|
 |
This graph image could be recreated using vector graphics as an SVG file. This has several advantages; see Commons:Media for cleanup for more information. If an SVG form of this image is already available, please upload it. After uploading an SVG, replace this template with {{ vector version available|new image name.svg}}. |
Image description page history
| link | date/time | username | edit summary |
|---|---|---|---|
| http://en.wikipedia.org/w/index.php?title=Image:Nuclear_Power_History.png&redirect=no&oldid=148007703 | 08:27, 25 August 2007 | w:en:User:Dmcdevit | |
| http://en.wikipedia.org/w/index.php?title=Image:Nuclear_Power_History.png&redirect=no&oldid=148007703 | 07:09, 30 July 2007 | w:en:User:Dragons flight | |
| http://en.wikipedia.org/w/index.php?title=Image:Nuclear_Power_History.png&redirect=no&oldid=148005285 | 06:47, 30 July 2007 | w:en:User:122.148.49.179 | |
| http://en.wikipedia.org/w/index.php?title=Image:Nuclear_Power_History.png&redirect=no&oldid=147517223 | 19:50, 27 July 2007 | w:en:User:Dragons flight | (== Description == This figure shows the history of nuclear power generation. The top panel shows the installed global nuclear capacity (in gigawatts), and since 1991, the fraction of that power which was actually available after accounting for p) |
File usage
About Schools Wikipedia
Wikipedia for Schools was collected by SOS Children's Villages. SOS Children is there for the children in our care until they are ready for independence. Help another child by taking out a sponsorship.