

File:Five Myr Climate Change.png

| |
This is a file from the Wikimedia Commons. Information from its description page there is shown below.
Commons is a freely licensed media file repository. You can help. |
Contents |
Summary
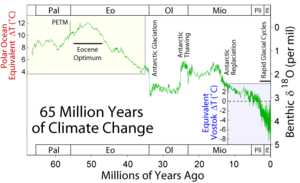
This figure shows the climate record of Lisiecki and Raymo (2005) constructed by combining measurements from 57 globally distributed deep sea sediment cores. The measured quantity is oxygen isotope fractionation ([[δ18O]]) in benthic foraminifera, which serves as a proxy for the total global mass of glacial ice sheets.
Lisiecki and Raymo constructed this record by first applying a computer aided process of adjusting individual "wiggles" in each sediment core to have the same alignment (i.e. wiggle matching). Then the resulting stacked record is orbitally tuned by adjusting the positions of peaks and valleys to fall at times consistent with an orbitally driven ice model (see Milankovitch cycles). Both sets of these adjustments are constrained to be within known uncertainties on sedimentation rates and consistent with independently dated tie points (if any). Constructions of this kind are common. However, they assume that ice volume is driven by changes in insolation, and such data therefore cannot be used to establish the existence of such a relationship.
Many studies have produced evidence that the two strongest orbital cycles ( obliquity, 41 kyr and precession, 26 kyr) probably do drive changes in ice volume. The data in the figure have been fitted to these periods and also to the longer, much weaker 100 kyr eccentricity cycle. Over the past ~1 million years there have been a number of very strong glacial maxima and minima, spaced by 80,000 - 120,000 years, but the evidence for orbital forcing of these events is less secure. It is likely that this ~100 kyr cycle is controlled by some other as yet unknown mechanism. For further discussion of orbital periodicities see Milankovitch cycles.
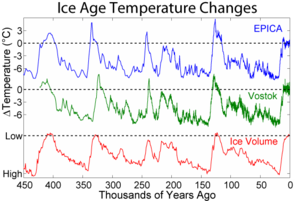
The observed isotope variations are very similar in shape to the temperature variations recorded at Vostok, Antarctica during the 420 kyr for which that record exists. Hence the right hand scale of the figure was established by fitting the reported temperature variations at Vostok (Petit et al. 1999) to the observed isotope variations. This temperature scale should be regarded as approximate and its magnitude only representative of the changes observed in the Vostok core. In particular, temperature changes at polar sites such as Vostok frequently exceed the changes observed in the tropics or in the global average. A horizontal line at 0 °C indicates modern temperatures (circa 1950).
 |
File:Five Myr Climate Change.svg is a vector version of this file. It should be used in place of this raster image when superior. File:Five Myr Climate Change.png
For more information about vector graphics, read about Commons transition to SVG.
|
 |
Copyright
This figure was prepared by Robert A. Rohde based on published data and is incorporated into the Global Warming Art project.
 |
Permission is granted to copy, distribute and/or modify this document under the terms of the GNU Free Documentation License, Version 1.2 or any later version published by the Free Software Foundation; with no Invariant Sections, no Front-Cover Texts, and no Back-Cover Texts. A copy of the license is included in the section entitled GNU Free Documentation License.
|
| This file is licensed under the Creative Commons Attribution-Share Alike 3.0 Unported license. | ||
|
||
| This licensing tag was added to this file as part of the GFDL licensing update.
|
References
- Lisiecki, Lorraine E.; Raymo, Maureen E. (January 2005). " A Pliocene-Pleistocene stack of 57 globally distributed benthic d18O records" (PDF). Paleoceanography 20: PA1003. DOI: 10.1029/2004PA001071.
-
- Supplement: Lisiecki, L. E.; Raymo, M. E. (2005). "Pliocene-Pleistocene stack of globally distributed benthic stable oxygen isotope records". Pangaea. DOI: 10.1594/PANGAEA.704257.
- Lisiecki, L. E.; Raymo, M. E. (May 2005). "Correction to “A Pliocene-Pleistocene stack of 57 globally distributed benthic d18O records”". Paleoceanography: PA2007. DOI: 10.1029/2005PA001164.
- Petit, J. R.; Jouzel, J.; Raynaud, D.; Barkov, N. I.; Barnola, J. M.; Basile, I.; Bender, M.; Chappellaz, J.; Davis, J.; Delaygue, G.; Delmotte, M.; Kotlyakov, V. M.; Legrand, M.; Lipenkov, V.; Lorius, C.; Pépin, L.; Ritz, C.; Saltzman, E.; Stievenard, M. (1999). "Climate and Atmospheric History of the Past 420,000 years from the Vostok Ice Core, Antarctica". Nature 399: 429-436. DOI: 10.1038/20859.
| Dragons flight's Temperature Record Series |
| This figure is part of series of plots created by Dragons flight to illustrate changes in Earth's temperature and climate across many different time scales. |
| Time Period: 25 yrs | 150 yrs | 1 kyr | 2 kyr | 12 kyr | 450 kyr | 5 Myr | 65 Myr | 500 Myr |
| For articles related to this topic see: Temperature record |
derivative works
Derivative works of this file:
File usage
Find out about Schools Wikipedia
All five editions of Schools Wikipedia were compiled by SOS Children. SOS Children believes education is an important part of a child's life. That's why we ensure they receive nursery care as well as high-quality primary and secondary education. When they leave school, we support the children in our care as they progress to vocational training or higher education. There are many ways to help with SOS Childrens Villages.