

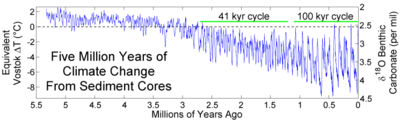
File:Ice Age Temperature.png

| |
This is a file from the Wikimedia Commons. Information from its description page there is shown below.
Commons is a freely licensed media file repository. You can help. |
Summary

This figure shows the Antarctic temperature changes during the last several glacial/interglacial cycles of the present ice age and a comparison to changes in global ice volume. The present day is on the right.
The first two curves shows local changes in temperature at two sites in Antarctica as derived from deuterium isotopic measurements (δD) on ice cores (EPICA Community Members 2004, Petit et al. 1999). The final plot shows a reconstruction of global ice volume based on δ18O measurements on benthic foraminifera from a composite of globally distributed sediment cores and is scaled to match the scale of fluctuations in Antarctic temperature (Lisiecki and Raymo 2005). Note that changes in global ice volume and changes in Antarctic temperature are highly correlated, so one is a good estimate of the other, but differences in the sediment record do not necessarily reflect differences in paleotemperature. Horizontal lines indicate modern temperatures and ice volume. However, since geological records such as ice cores and sediments represent an average often on the scale of thousands of years, direct comparison to current values can be misleading. Larger, short term variations in ancient climate are not present in the fossil record. Hence the comparison is not comparing like with like and is scientifically invalid. Differences in the alignment of various features reflect dating uncertainty and do not indicate different timing at different sites.
The Antarctic temperature records indicate that the present interglacial is relatively cool compared to previous interglacials, at least at these sites. The Liesecki & Raymo (2005) sediment reconstruction does not indicate significant differences between modern ice volume and previous interglacials, though some other studies do report slightly lower ice volumes / higher sea levels during the 120 ka and 400 ka interglacials (Karner et al. 2001, Hearty and Kaufman 2000).
It should be noted that temperature changes at the typical equatorial site are believed to have been significantly less than the changes observed at high latitude.
 |
This graph image could be recreated using vector graphics as an SVG file. This has several advantages; see Commons:Media for cleanup for more information. If an SVG form of this image is already available, please upload it. After uploading an SVG, replace this template with {{ vector version available|new image name.svg}}. |
Copyright
This figure was produced by Robert A. Rohde from publicly available data and is incorporated into the Global Warming Art project.
 |
Permission is granted to copy, distribute and/or modify this document under the terms of the GNU Free Documentation License, Version 1.2 or any later version published by the Free Software Foundation; with no Invariant Sections, no Front-Cover Texts, and no Back-Cover Texts. A copy of the license is included in the section entitled GNU Free Documentation License.
|
| This file is licensed under the Creative Commons Attribution-Share Alike 3.0 Unported license. | ||
|
||
| This licensing tag was added to this file as part of the GFDL licensing update.
|
References
- Petit J.R., Jouzel J., Raynaud D., Barkov N.I., Barnola J.M., Basile I., Bender M., Chappellaz J., Davis J., Delaygue G., Delmotte M., Kotlyakov V.M., Legrand M., Lipenkov V., Lorius C., Pépin L., Ritz C., Saltzman E., Stievenard M. (1999) Climate and Atmospheric History of the Past 420,000 years from the Vostok Ice Core,
ctica, Nature, 399, 429-436.
- Lisiecki, L. E., and M. E. Raymo (2005), A Pliocene-Pleistocene stack of 57 globally distributed benthic d18O records, Paleoceanography, 20, PA1003, doi:10.1029/2004PA001071.
- Hearty, P.J. and Kaufman, D.S. (2000) Whole-rock aminostratigraphy and Quaternary sea-level history of the Bahamas, Quaternary Research 54, 163-173.
- D. B. Karner, J. Levine, B. P. Medeiros, R. A. Muller (2002) Constucting a Stacked Benthic δ18O Record, Paleoceanography 17:0, doi:10.1029/2001PA000667.
| Dragons flight's Temperature Record Series |
| This figure is part of series of plots created by Dragons flight to illustrate changes in Earth's temperature and climate across many different time scales. |
| Time Period: 25 yrs | 150 yrs | 1 kyr | 2 kyr | 12 kyr | 450 kyr | 5 Myr | 65 Myr | 500 Myr |
| For articles related to this topic see: Temperature record |
File usage
What is Schools Wikipedia?
SOS Children's Villages aims to make Wikipedia suitable for young learners. SOS Children is a global charity founded in 1949 to give children who have lost everything the childhood they deserve. Would you like to sponsor a child?