Imagen:Logarithmic spiral.png
De Wikipedia, la enciclopedia libre

Logarithmic_spiral.png (24KB, tipo MIME : image/png)
| | Éste es un fichero de Wikimedia Commons, un depósito de contenido libre hospedado por la Fundación Wikimedia. Más abajo se reproduce su página de descripción con la información sobre su origen y licencia. |
 |
This Math image (or all images in this article or category) should be recreated using vector graphics as an SVG file. This has several advantages; see Commons:Images for cleanup for more information. If an SVG form of this image is already available, please upload it. After uploading an SVG, replace this template with template {{SupersededSVG|new image name.svg}} in this image.
Česky | Deutsch | English | Español | Français | Italiano | Nederlands | Polski | Português | Русский | العربية | +/- |
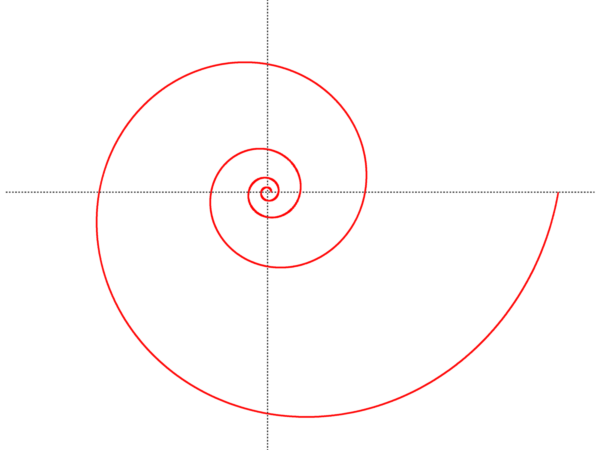
This graph of a logarithmic spiral was produced using the gnuplot program with input
# Output to png file:
set terminal png small color
set output "logarithmic_spiral.png"

# Same scale for both axes, half-size output:
set size ratio -1 0.5, 0.5

# More sample points to produce smoother picture:
set samples 170

# Axes in the center, no tick marks:
set zeroaxis
set noxtics
set noytics
set noborder
set polar

# set title "Logarithmic spiral (pitch 10 degrees)"

plot [-4*pi:4*pi] [-8:10] [-8:6] 1.19**t notitle
Last edition of the image by MarkSweep
 |
Permission is granted to copy, distribute and/or modify this document under the terms of the GNU Free Documentation License, Version 1.2 or any later version published by the Free Software Foundation; with no Invariant Sections, no Front-Cover Texts, and no Back-Cover Texts. A copy of the license is included in the section entitled "GNU Free Documentation License".
العربية | Česky | Deutsch | English | Español | Français | Italiano | 日本語 | 한국어 | Nederlands | Polski | Português | Slovenčina | Svenska | עברית +/- |
Enlaces a la imagen
Las siguientes páginas enlazan a esta imagen:

