

File:Oil consumption per day by region from 1980 to 2006.svg
| |
This is a file from the Wikimedia Commons. Information from its description page there is shown below.
Commons is a freely licensed media file repository. You can help. |
| Description |
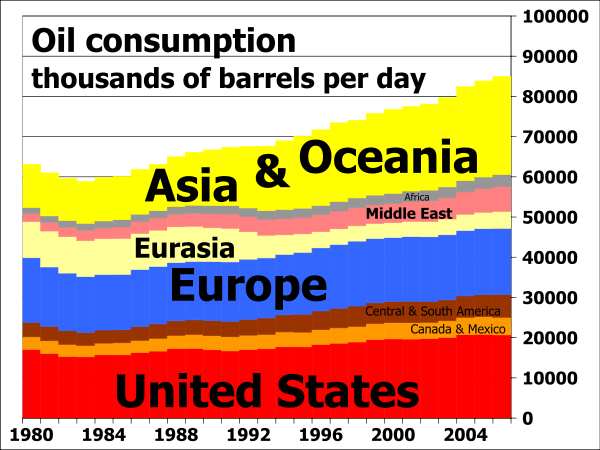
English: Oil consumption in daily barrels per region from 1980 to 2006; vertical extents indicate barrels of oil consumed per day, and the horizontal scale shows years from 1980 to 2007.
|
| Date | 25 October 2008 |
| Source | I, 84user, created this work using the excel file RecentPetroleumConsumptionBarrelsperDay.xls from the U.S. Energy Information Administration's web page http://tonto.eia.doe.gov/dnav/pet/pet_pri_wco_k_w.htm (direct link: http://www.eia.doe.gov/emeu/international/RecentPetroleumConsumptionBarrelsperDay.xls) and using Open Source Gnumeric 1.9.1 to produce the chart. See also 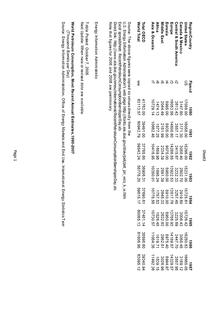 |
| Author | 84user |
| Permission ( Reusing this file) |
PD-SELF; Released into the public domain (by the author). |
See also


Licensing
 |
This work has been released into the public domain by its author, 84user. This applies worldwide. In some countries this may not be legally possible; if so: 84user grants anyone the right to use this work for any purpose, without any conditions, unless such conditions are required by law.
|
File usage
The following pages on Schools Wikipedia link to this image (list may be incomplete):
Metadata
About Schools Wikipedia
All five editions of Schools Wikipedia were compiled by SOS Childrens Villages. The world's largest orphan charity, SOS Childrens Villages brings a better life to more than 2 million people in 133 countries around the globe. Help another child by taking out a sponsorship